Portfolio


Published on Jul 03, 2020 by Yunwoong Kim on Deep Learning
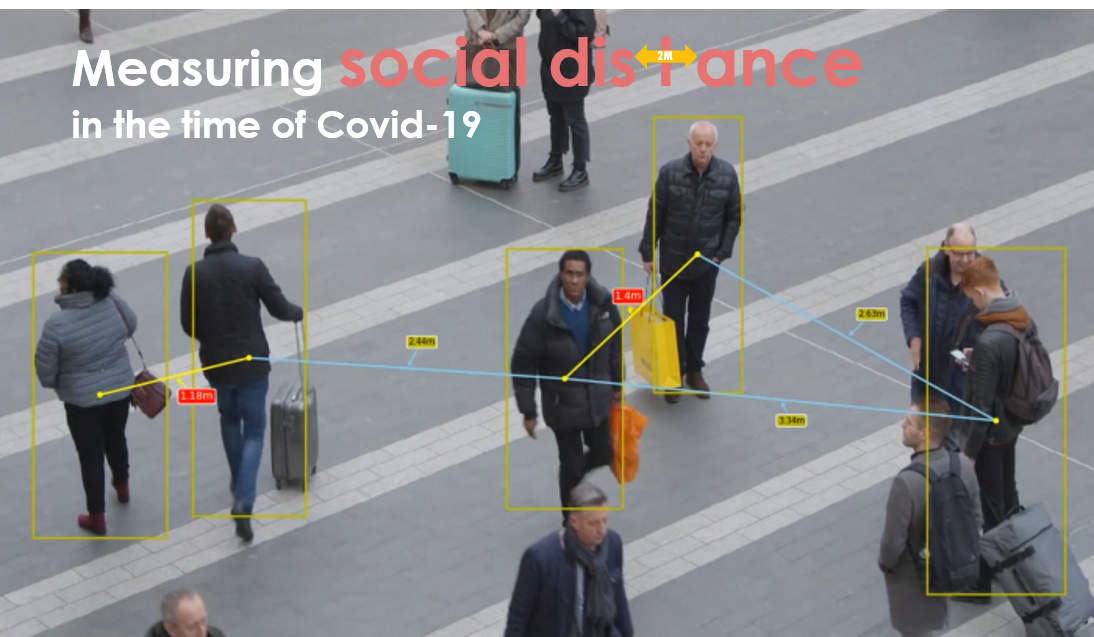
오늘날 불행히도 모든 사람들은 “사회적 거리” 라는 용어에 익숙합니다 . 모든 것이 정상으로 돌아올 때까지 우리는 잠시 동안 코로나 바이스러와 함께 살아야 할 것입니다. 이전 Blog 게시글에서도 언급 했듯이 전세계의 많은 IT 기술자들이 정보를 공유하고 다양한 방식으로 참여하고 있습니다.
이번에는 Object Detection 을 이용하여 보행자 사이의 사회적 거리를 식별하고 측정하는 애플리케이션을 개발하려고 합니다 .
사람을 Detect 하기 위해서 YOLO object detector를 사용합니다.
labelsPath = os.path.sep.join([config.YOLO_MODEL_PATH, "coco.names"])

self.LABELS = open(labelsPath).read().strip().split("\n")

weightsPath = os.path.sep.join([config.YOLO_MODEL_PATH, "yolov3.weights"])
configPath = os.path.sep.join([config.YOLO_MODEL_PATH, "yolov3.cfg"])

self.net = cv2.dnn.readNetFromDarknet(configPath, weightsPath)
self.ln = self.net.getLayerNames()
self.ln = [self.ln[i[0] - 1] for i in self.net.getUnconnectedOutLayers()]

if config.USE_GPU:
    # CUDA Setting
    os.environ["CUDA_DEVICE_ORDER"] = "PCI_BUS_ID"
    os.environ["CUDA_VISIBLE_DEVICES"] = "0, 1, 2,3"
    self.net.setPreferableBackend(cv2.dnn.DNN_BACKEND_CUDA)
    self.net.setPreferableTarget(cv2.dnn.DNN_TARGET_CUDA)
frame = cv2.cvtColor(frame, cv2.COLOR_BGR2RGB)
results = detect_people(frame, self.net, self.ln, personIdx=self.LABELS.index("person"))
centroids = []
coordinates = []

# # Calculate normalized coordinates for boxes
for (i, (prob, bbox, centroid)) in enumerate(results):
coord = calculate_coord(bbox, i)
centr = calculate_centr(coord)
centroids.append(centr)
coordinates.append(coord)

permutations = calculate_perm(centroids)

# Display boxes and centroids
fig, ax = plt.subplots(figsize = (10,6), dpi = 90, frameon=False)
ax = fig.add_axes([0, 0, 1, 1])
ax.axis('off')
ax.spines['top'].set_visible(False)
ax.spines['right'].set_visible(False)
ax.spines['bottom'].set_visible(False)
ax.spines['left'].set_visible(False)
ax.get_xaxis().set_ticks([])
ax.get_yaxis().set_ticks([])
for coord, centr in zip(coordinates, centroids):
ax.add_patch(patches.Rectangle((coord[0], coord[1]), coord[2], coord[3], linewidth=2, edgecolor='lime', facecolor='none', zorder=10))
ax.add_patch(patches.Circle((centr[0], centr[1]), 3, color='lime', zorder=20))

# Display lines between centroids
for perm in permutations:
    dist = calculate_centr_distances(perm[0], perm[1])
    dist_m = dist/self.sb_averagePxMeter.value()

x1 = perm[0][0]
y1 = perm[0][1]
x2 = perm[1][0]
y2 = perm[1][1]

person_index1 = perm[0][2]
person_index2 = perm[1][2]

# Calculate middle point
middle = midpoint(perm[0], perm[1])

# Calculate slope
slope = calculate_slope(x1, y1, x2, y2)
dy = math.sqrt(3**2/(slope**2+1))
dx = -slope*dy

# Set random location
if randrange(10) % 2== 0:
    Dx = middle[0] - dx*10
    Dy = middle[1] - dy*10
else:
    Dx = middle[0] + dx*10
    Dy = middle[1] + dy*10
if dist_m < self.sb_socialDistanceMeter.value():

if self.cb_line.isChecked():
    ax.annotate("{}m".format(round(dist_m, 2)), xy=middle, color='white', xytext=(Dx, Dy), fontsize=10, arrowprops=dict(arrowstyle='->', lw=1.5, color='yellow'), bbox=dict(facecolor='red', edgecolor='white', boxstyle='round', pad=0.2), zorder=35)
    ax.plot((perm[0][0], perm[1][0]), (perm[0][1], perm[1][1]), linewidth=2, color='red', zorder=15)

    ax.add_patch(patches.Rectangle((coordinates[person_index1][0], coordinates[person_index1][1]), coordinates[person_index1][2], coordinates[person_index1][3], linewidth=2, edgecolor='r',facecolor='none', zorder=10))
    ax.add_patch(patches.Rectangle((coordinates[person_index2][0], coordinates[person_index2][1]), coordinates[person_index2][2], coordinates[person_index2][3], linewidth=2, edgecolor='r', facecolor='none', zorder=10))
    ax.add_patch(patches.Circle((centroids[person_index1][0], centroids[person_index1][1]), 3, color='red', zorder=20))
    ax.add_patch(patches.Circle((centroids[person_index2][0], centroids[person_index2][1]), 3, color='red', zorder=20))
    # cv2.line(frame, (int(x1), int(y1)), (int(x2), int(y2)), color=(255,0, 0), thickness=2)
    elif self.sb_socialDistanceMeter.value() < dist_m < self.sb_socialDistanceMeter.value() + 1.5:
    if self.cb_line.isChecked():
    ax.annotate("{}m".format(round(dist_m, 2)), xy=middle, color='black', xytext=(Dx, Dy), fontsize=8, arrowprops=dict(arrowstyle='->', lw=1.5, color='skyblue'), bbox=dict(facecolor='y', edgecolor='white', boxstyle='round', pad=0.2), zorder=35)
    ax.plot((perm[0][0], perm[1][0]), (perm[0][1], perm[1][1]), linewidth=2, color='skyblue', zorder=15)
else:
	pass


좀 더 고민 할 부분이 많지만 UI를 포함하여 수정 할 수 있도록 만들었습니다.
